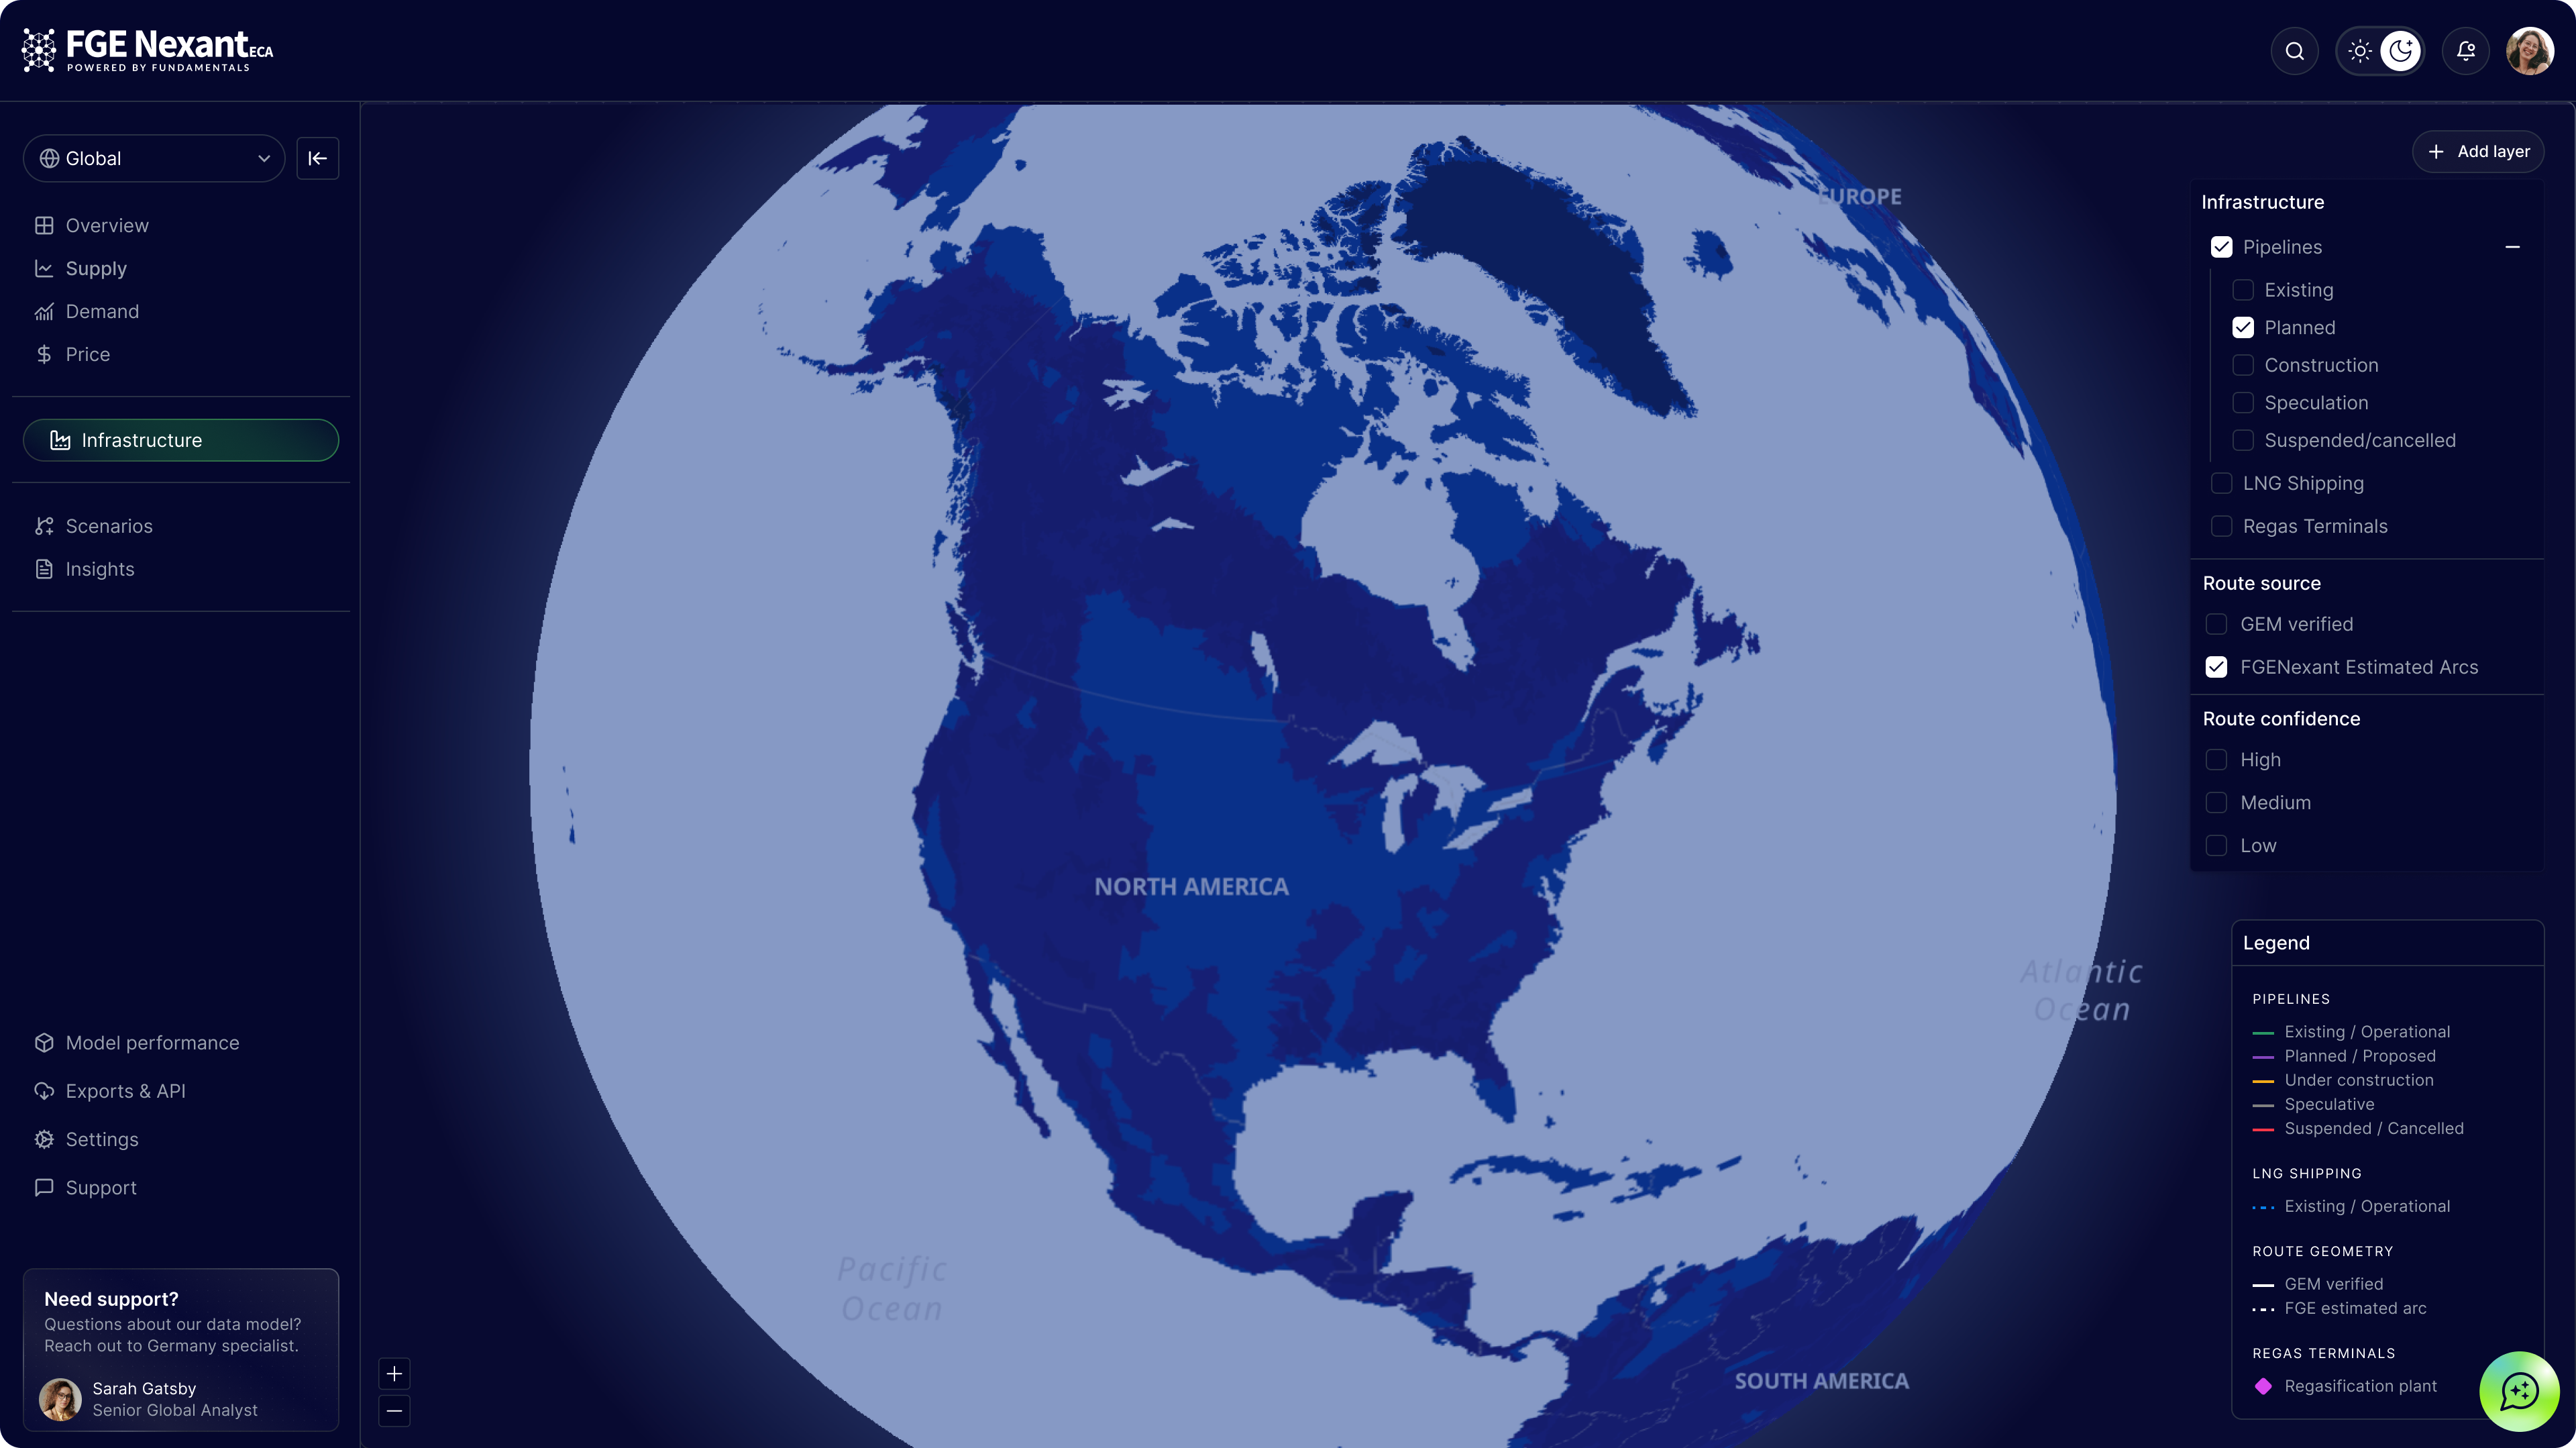
I contributed to the launch of Lumen, an AI-powered energy intelligence platform for long-term gas and LNG decision-making. My focus was the platform's interactive map, turning complex market and scenario data into a clear, visual way for users to explore global gas and LNG activity. I also supported the wider integration of market data, scenario modelling, expert analysis and AI workflows, helping shape a faster, more accessible and insight-driven experience.
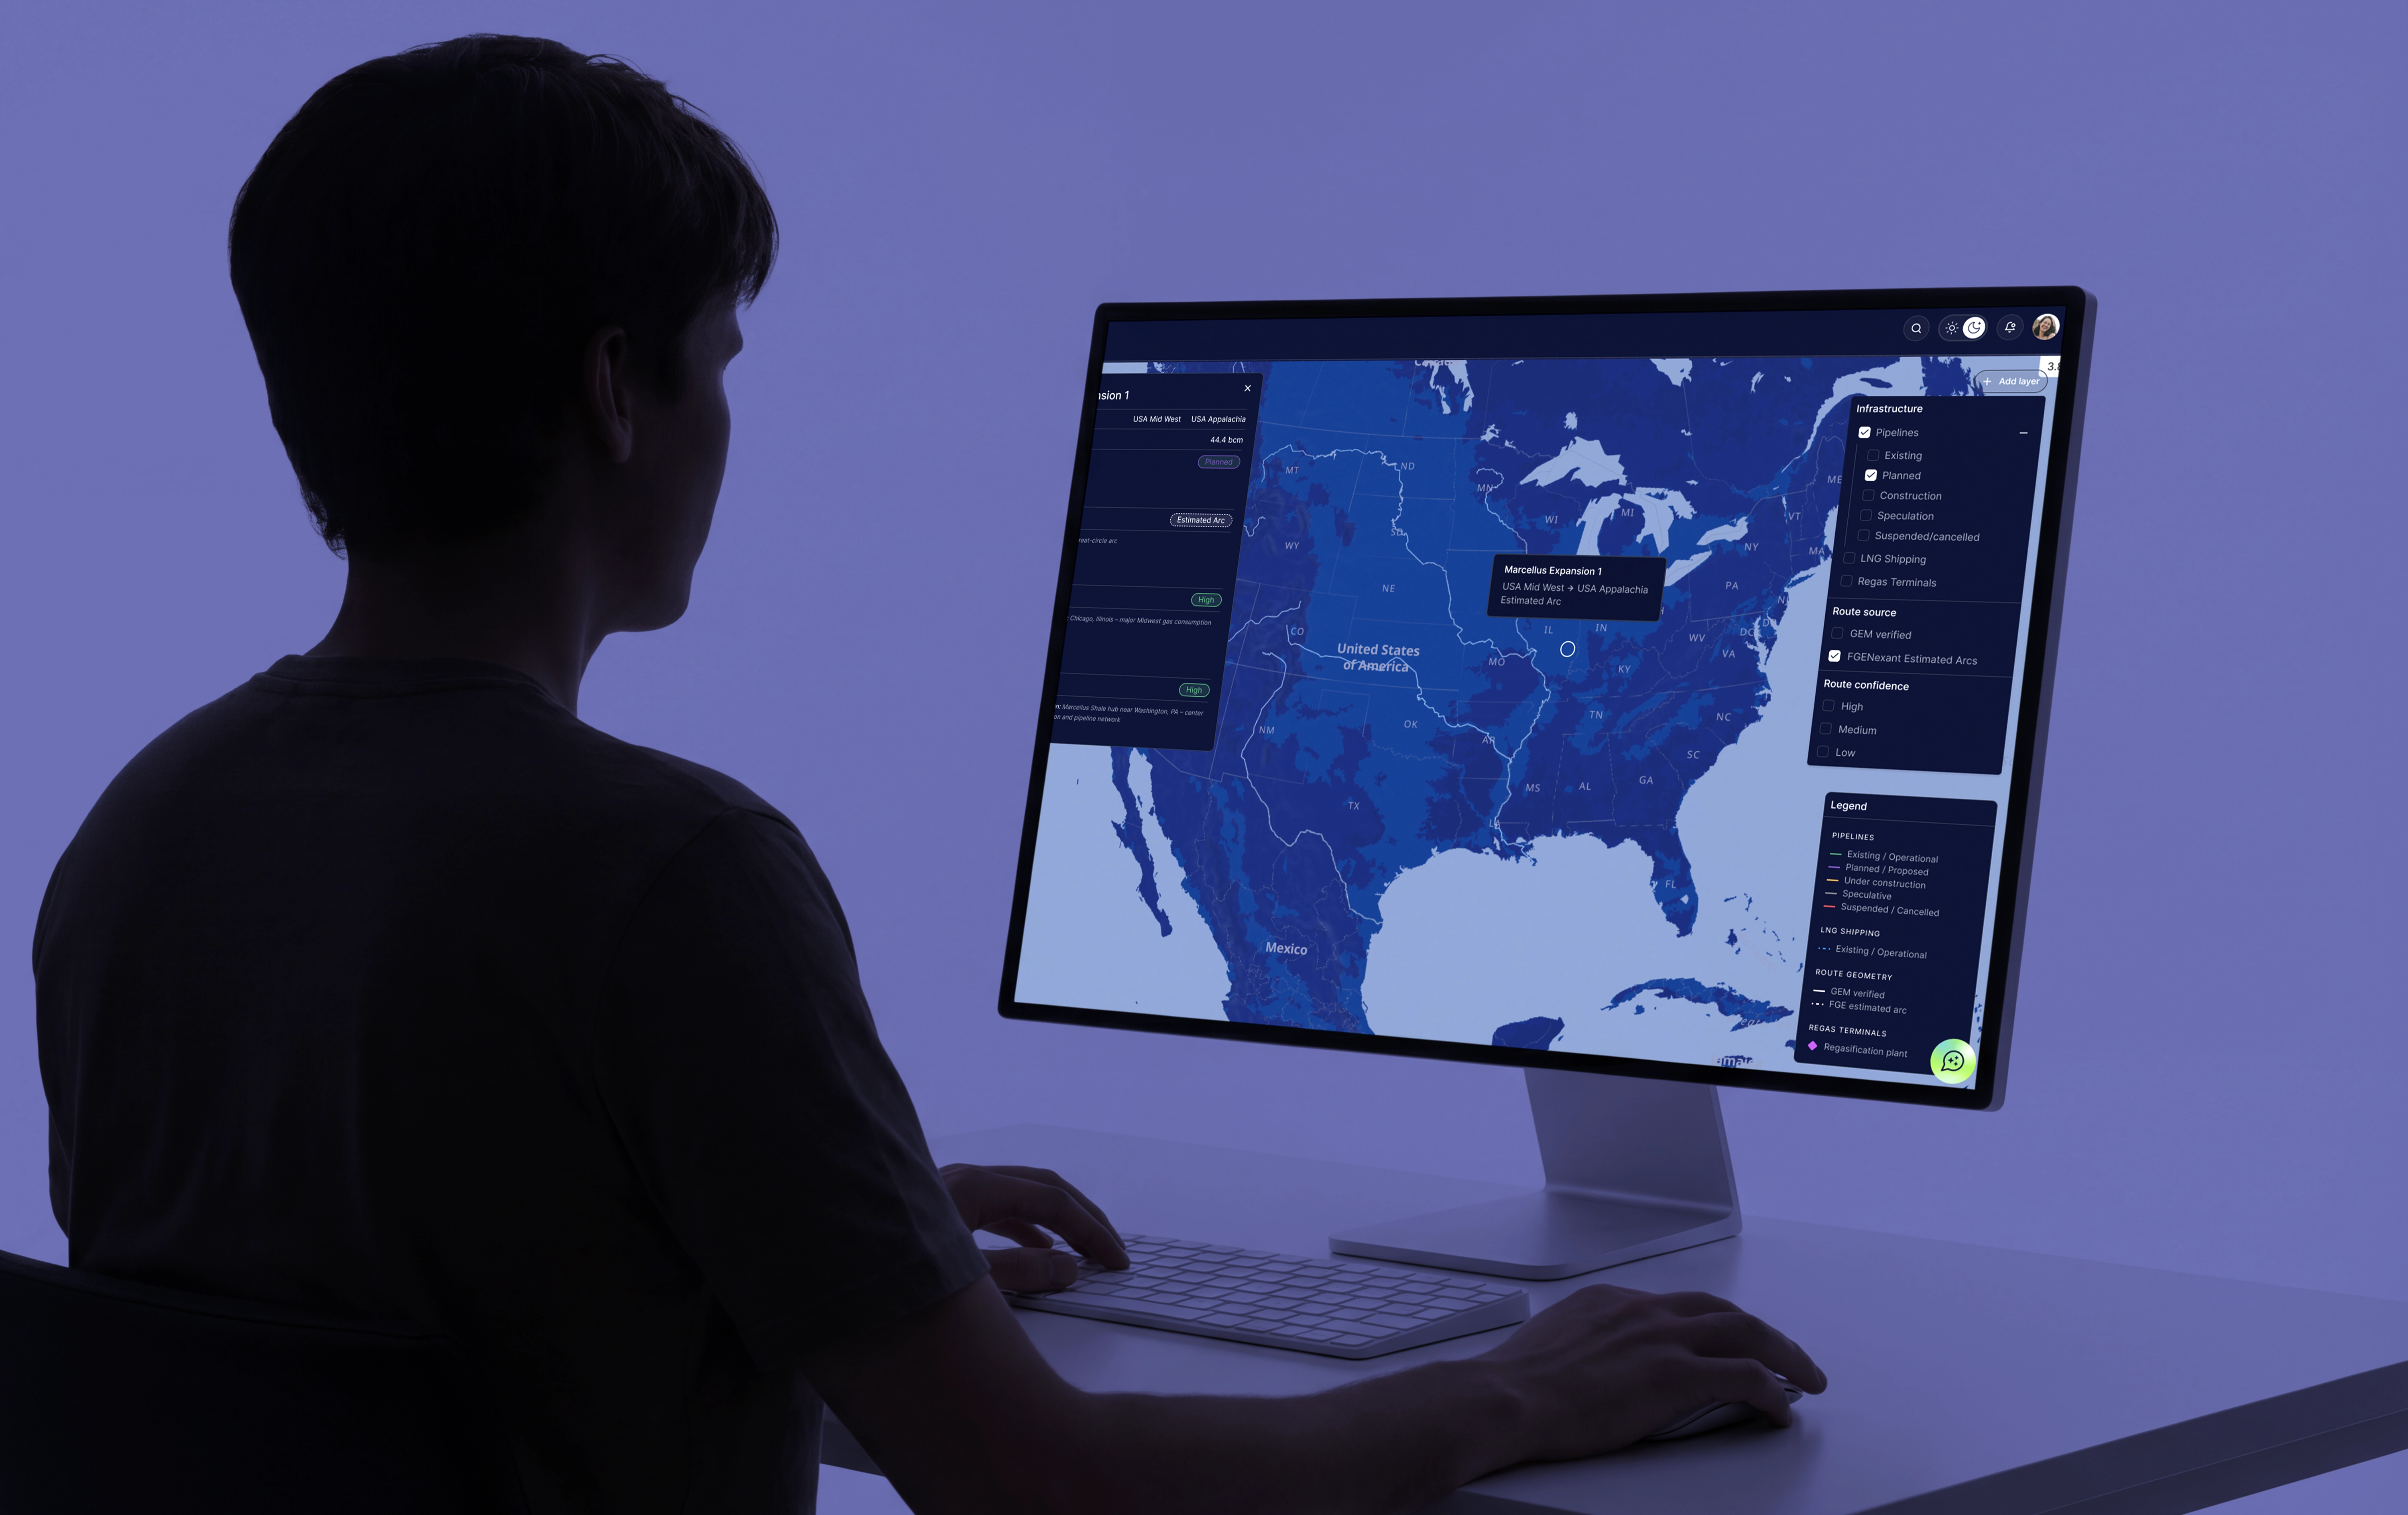
Two legacy organisations were merging their data offerings for the first time, covering crude oil, refined products, NGL, gas, LNG and green energy across the entire value chain. This was high stakes and high visibility internally, and I joined late in the process with the launch date already fixed.
My job was to design an interactive infrastructure map with dynamic layer controls, letting users toggle data layers on and off and see live results, alongside shoring up the general UX across the product. I started by mapping the existing state of the product and identifying the highest impact gaps, then worked in parallel streams so the map and the wider UX could move at the same time.
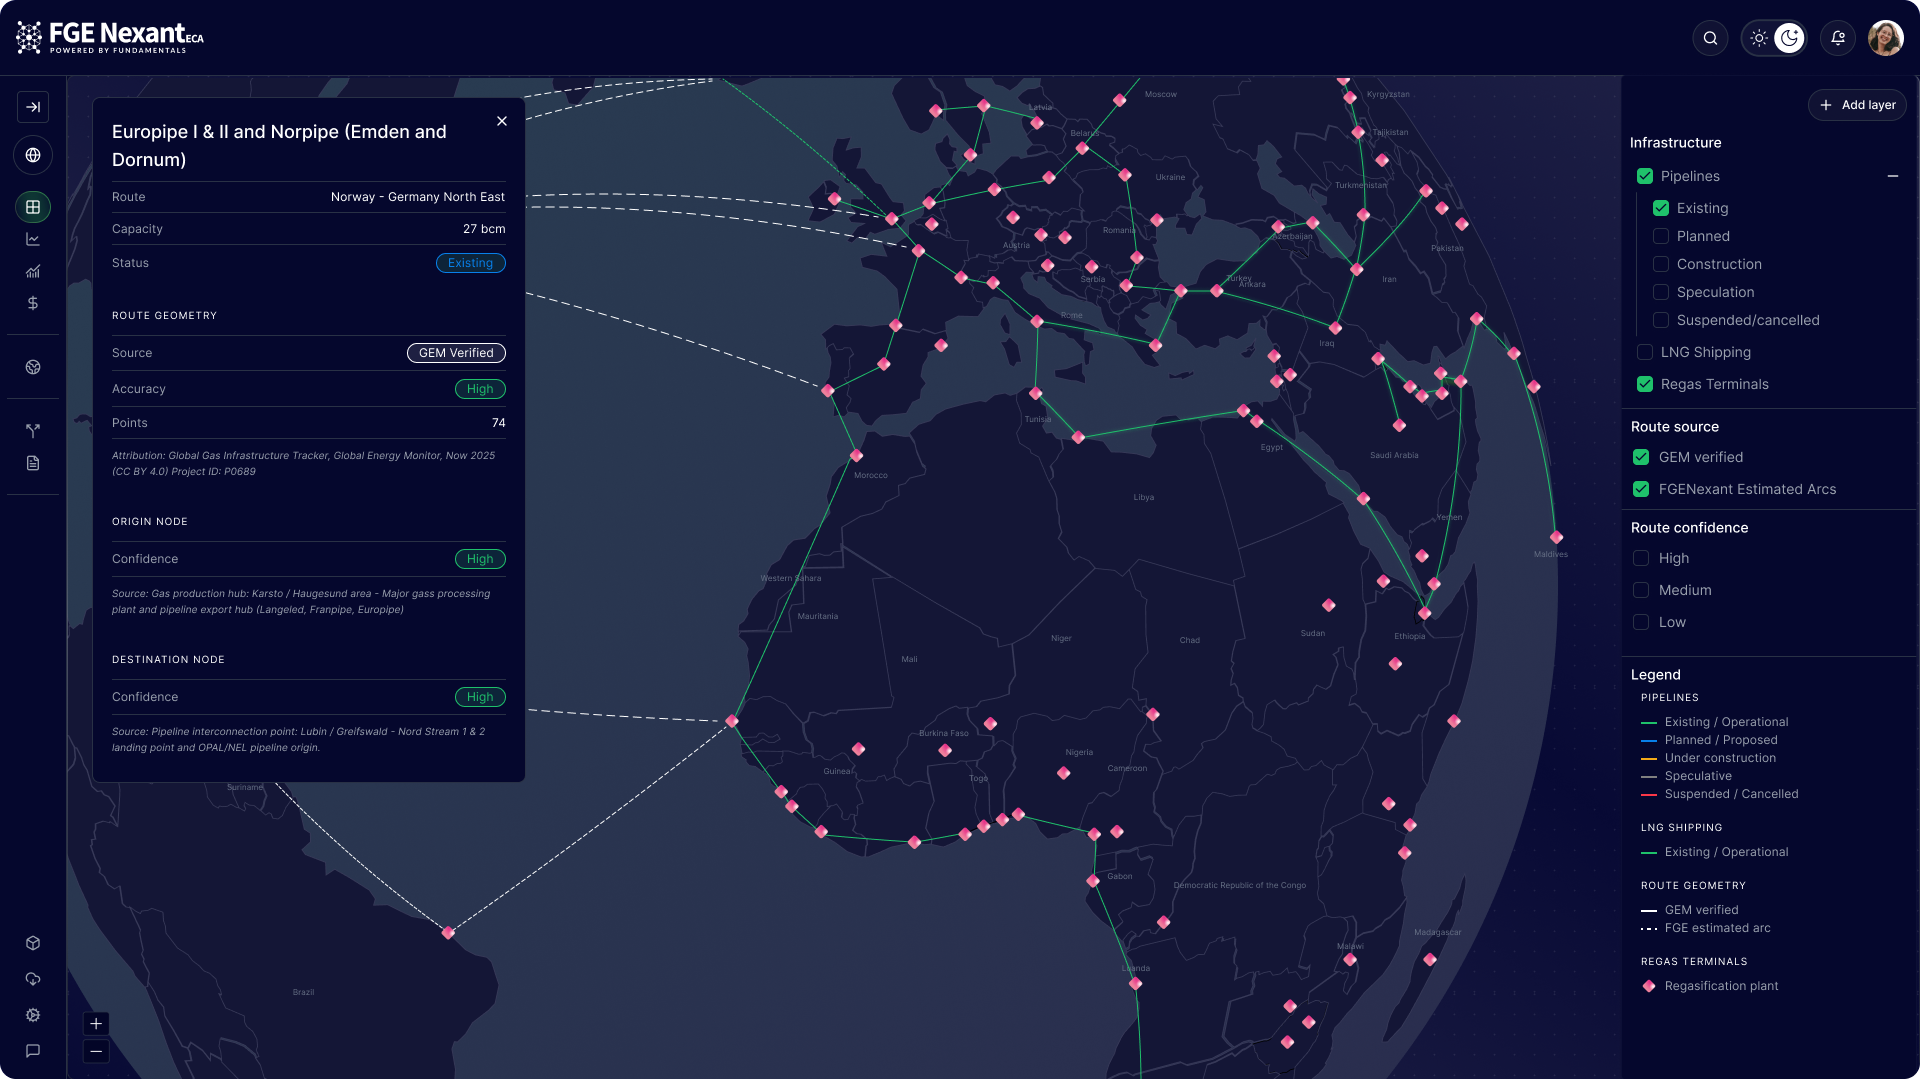
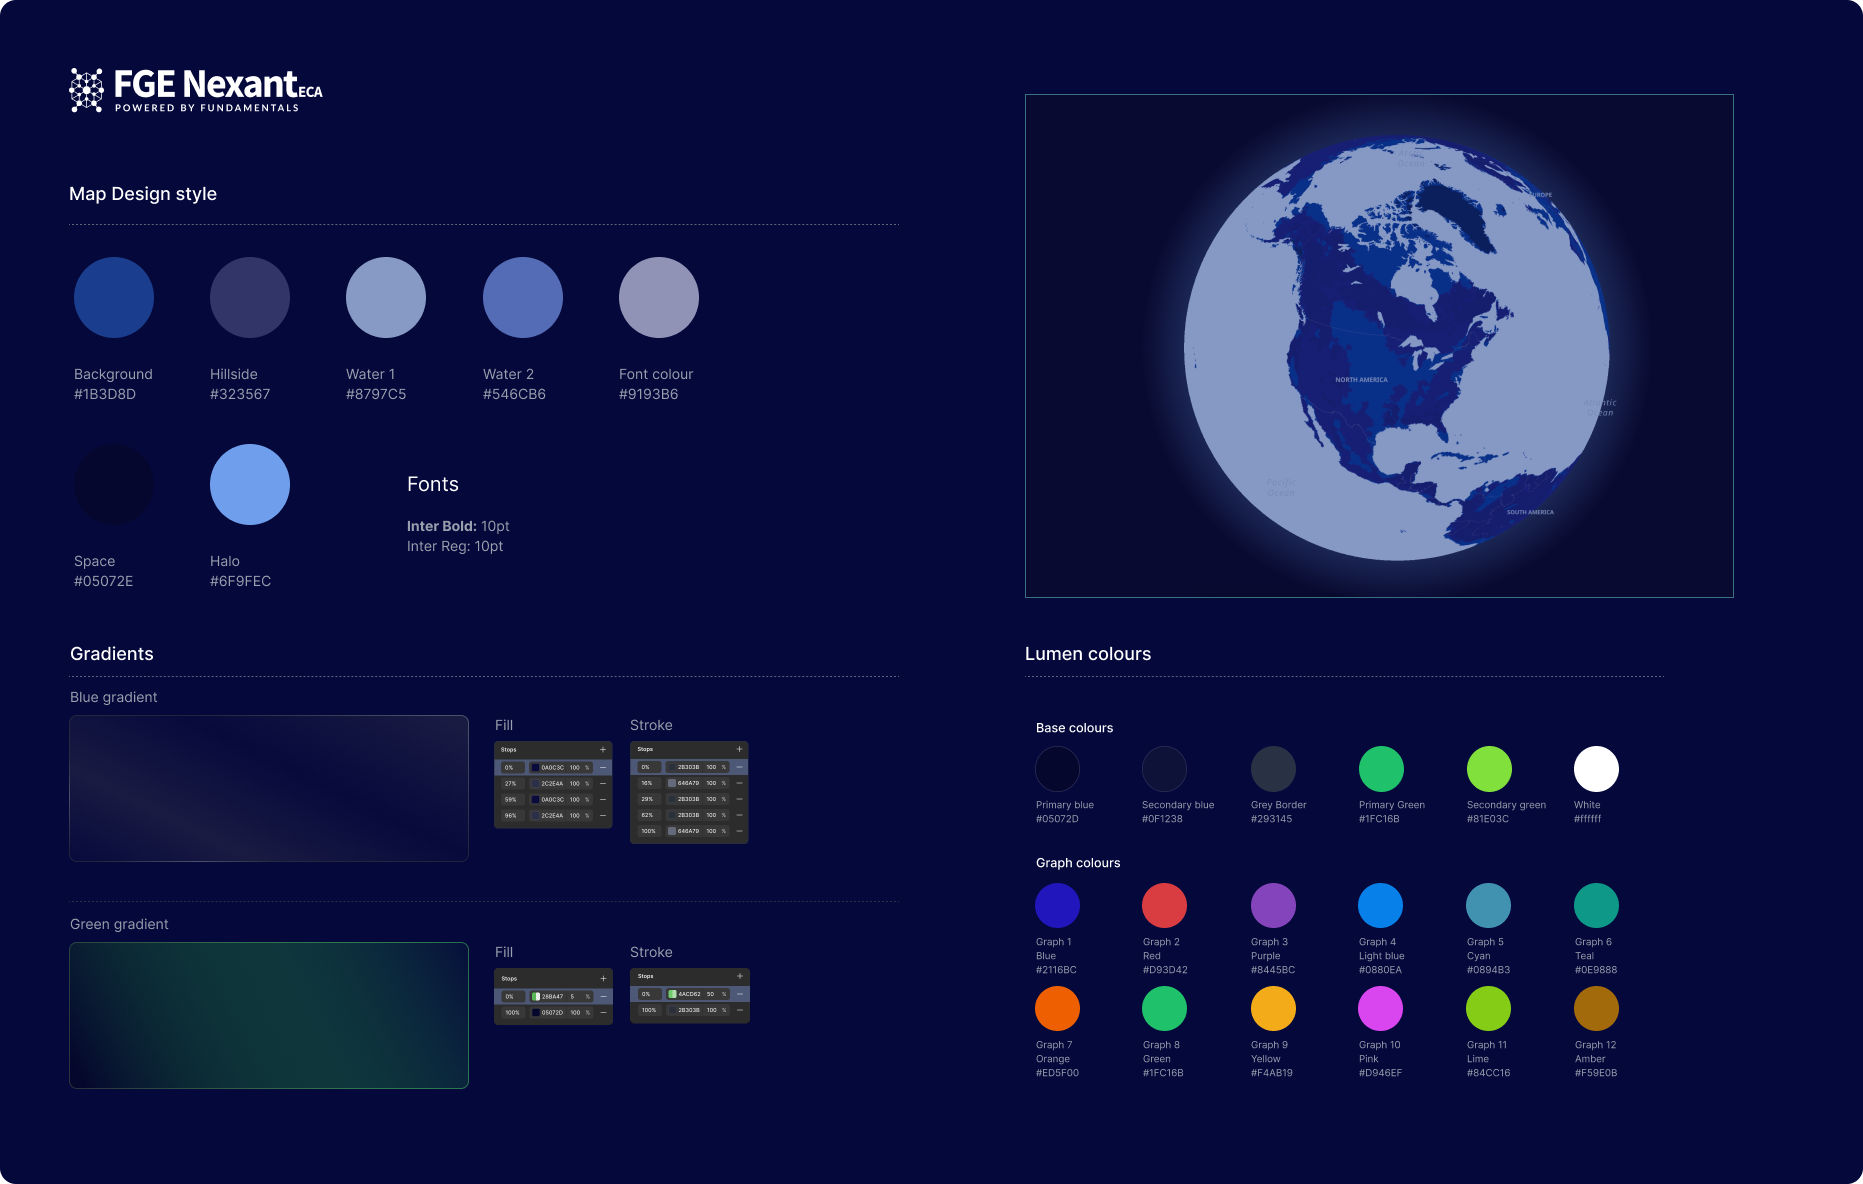
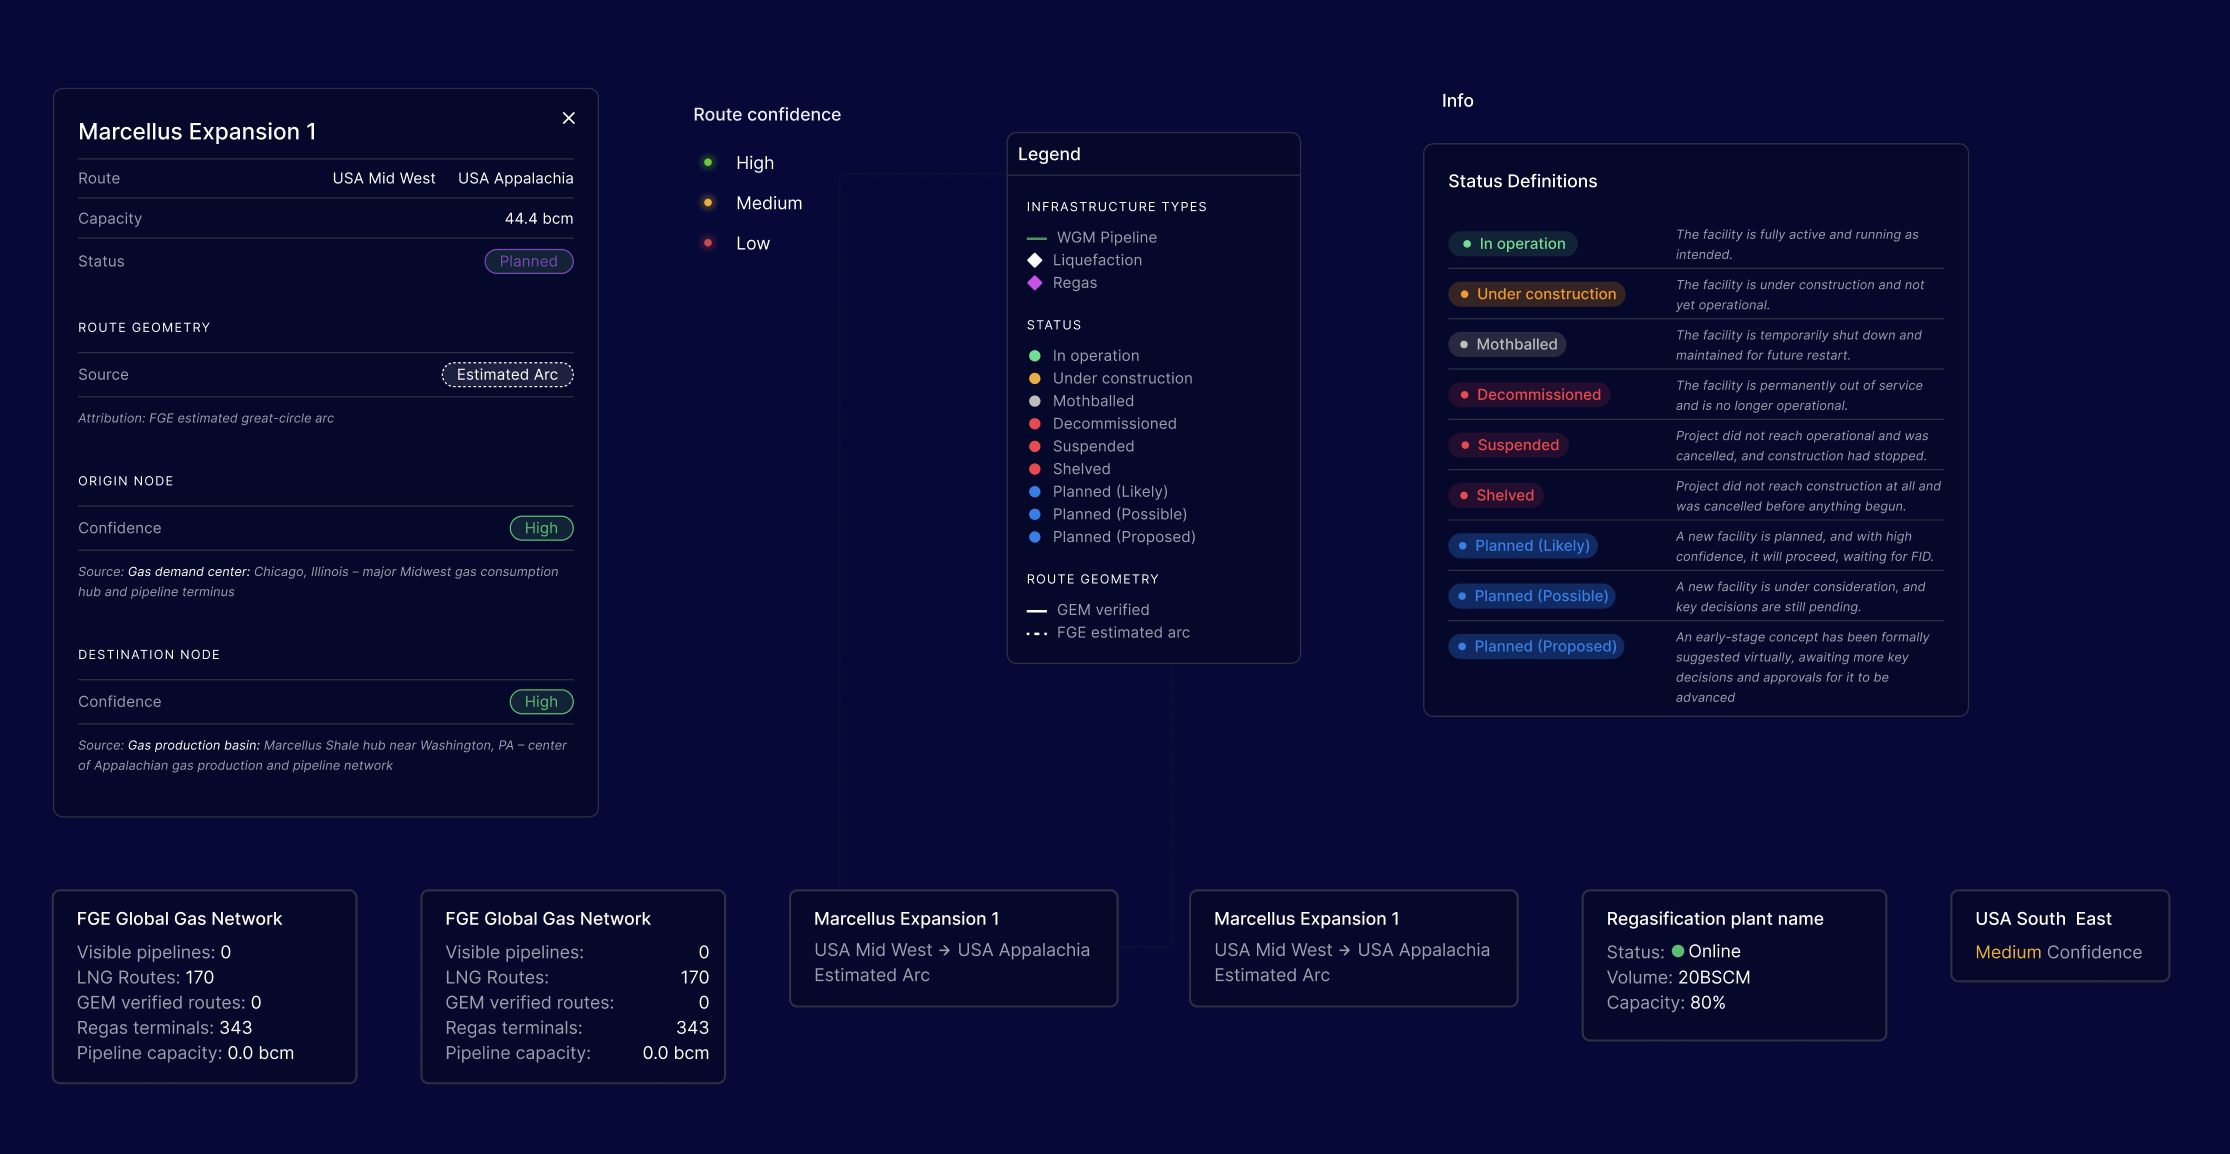
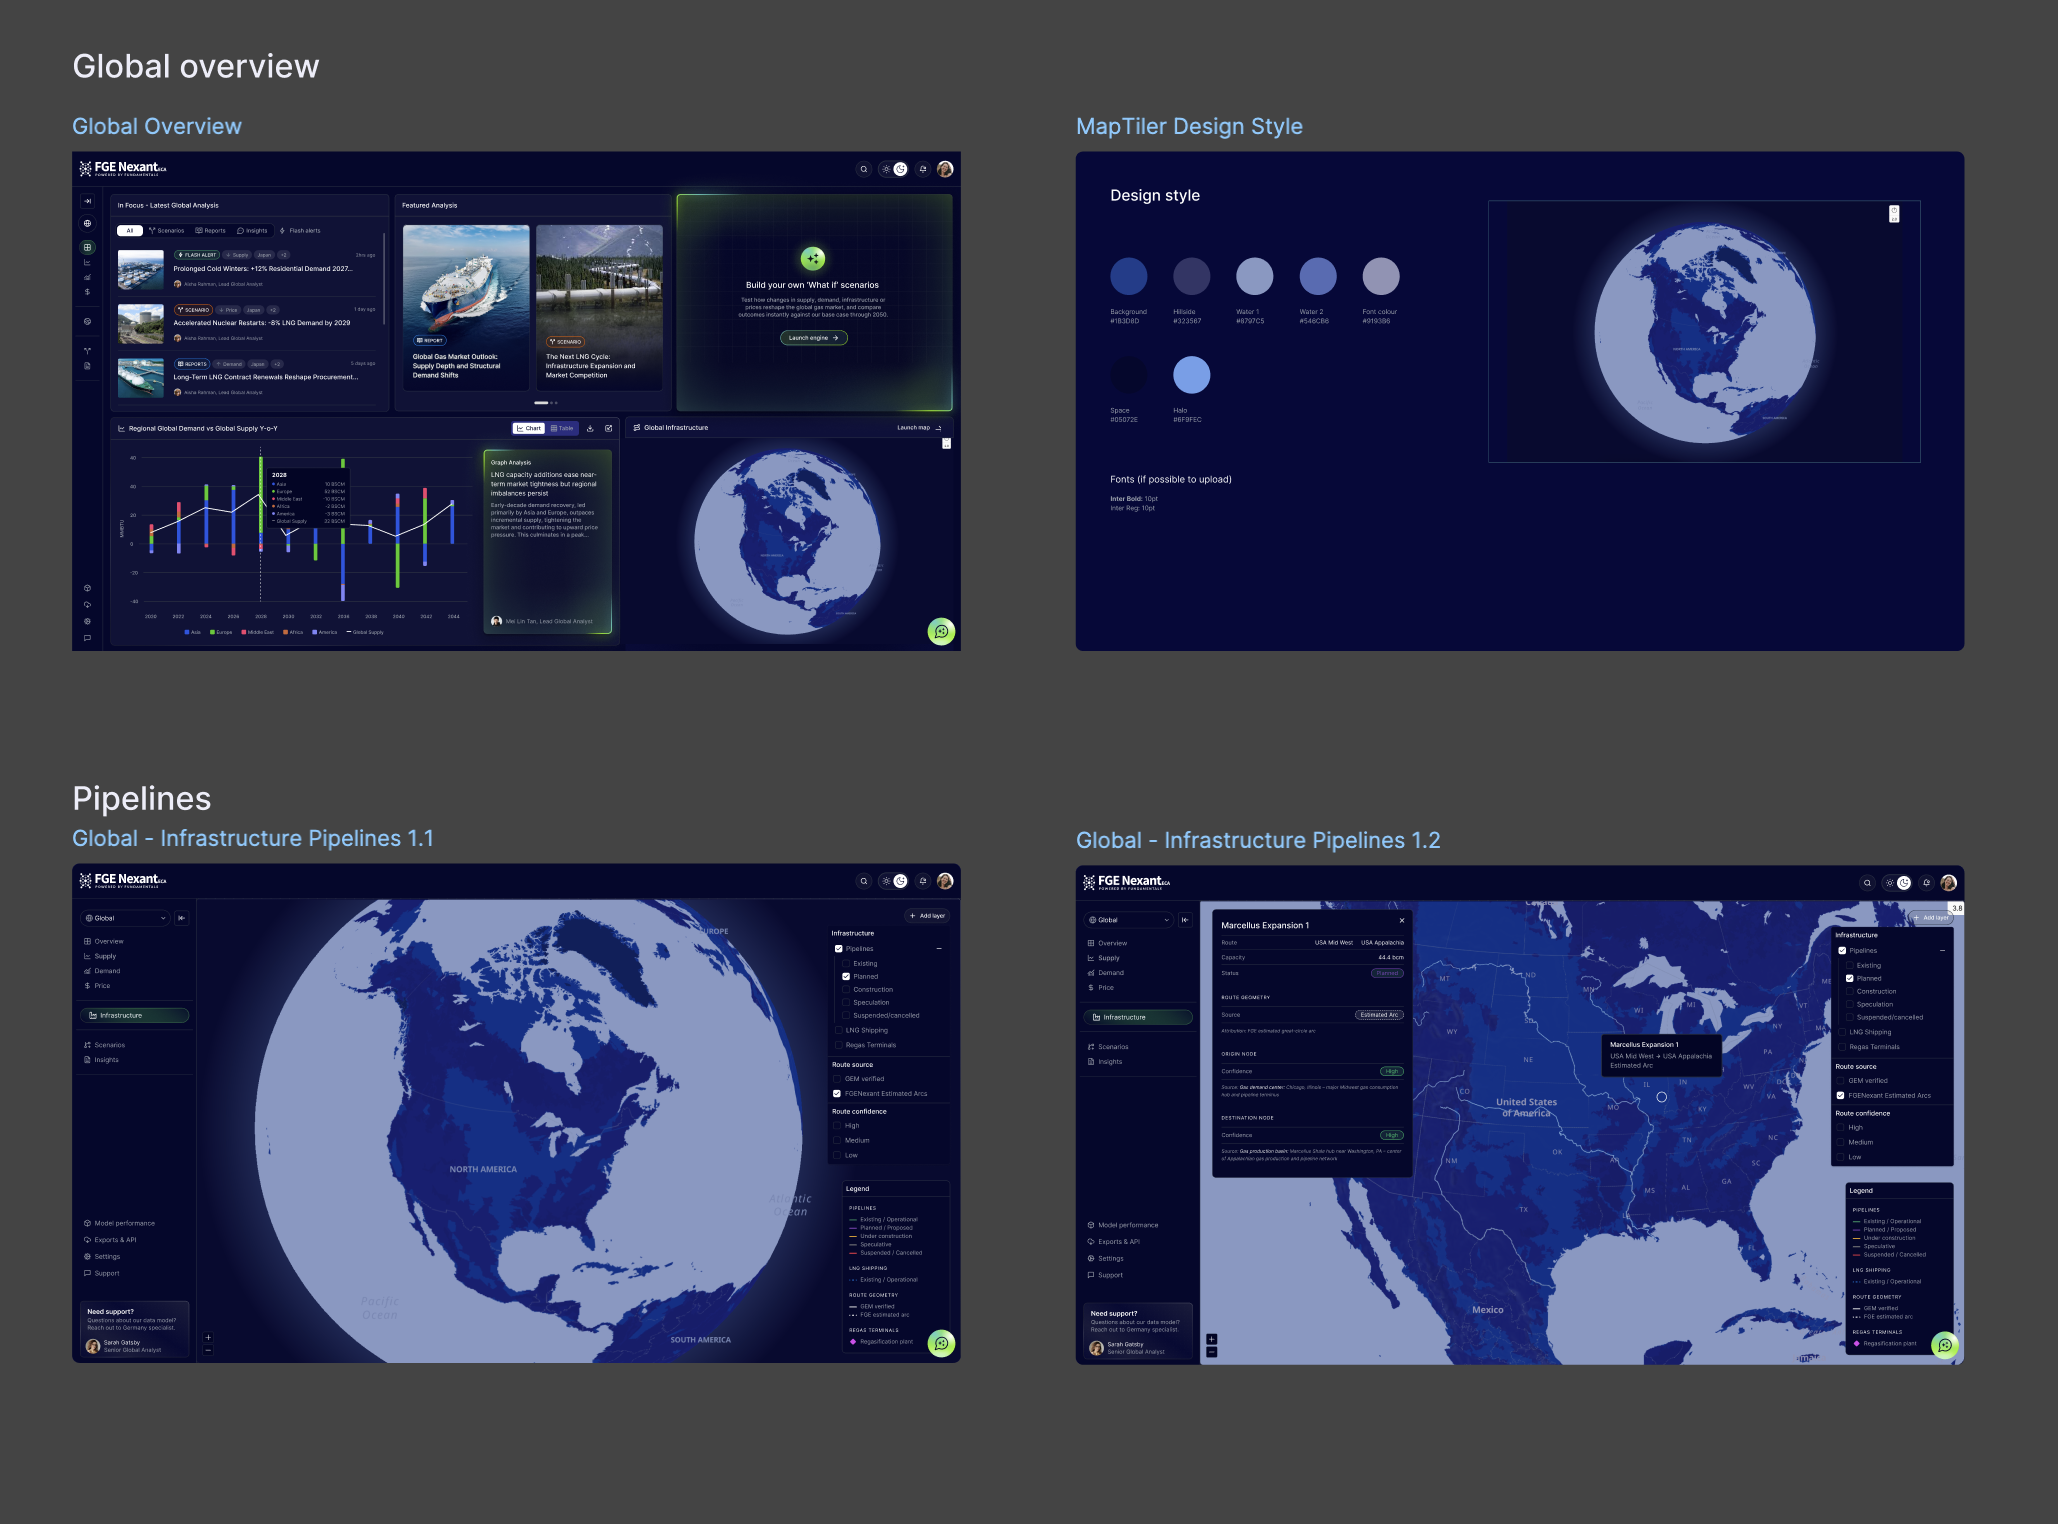

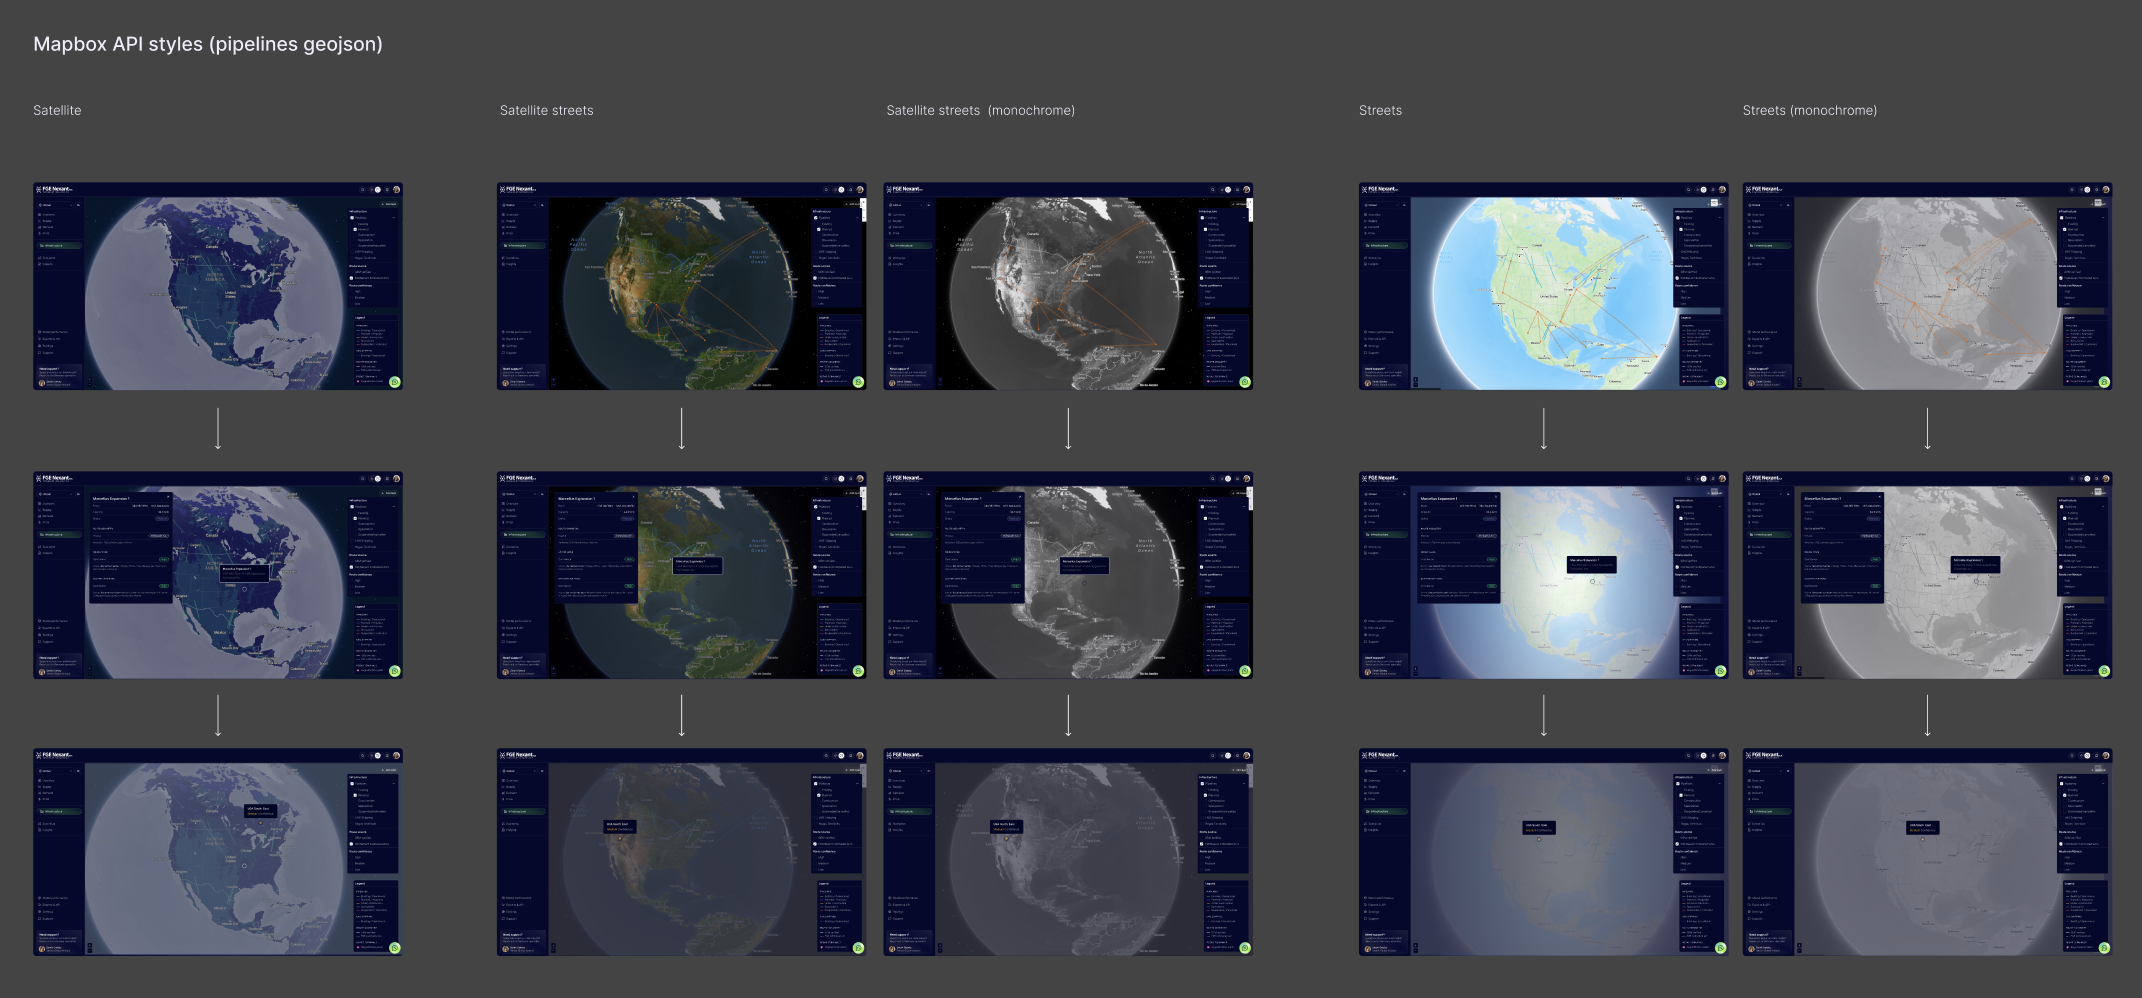
I ran contextual research with analysts and traders to understand how they actually consumed market data, and reviewed the existing FGE and NexantECA tooling to find redundancy and friction. Prototyping started in Mapbox for the layer interactions, then moved to MapTiler when licensing and performance issues came up. I built clickable Figma prototypes so stakeholders could react to real interactions rather than imagine them from a description, which sped up sign off considerably.
Every constraint on this project pushed me toward a better decision. Scope shifted regularly as the two organisations aligned on what the product actually needed to be, so I designed modular components that could be reconfigured without a full redesign, and kept stakeholders aligned through visual progress artefacts rather than status reports. Tooling changed mid-project too, and I treated each change as a design decision rather than a blocker. With engineering bandwidth tight throughout, I prioritised ruthlessly, focusing on whatever delivered the most user value per engineering hour, and kept my designs documented and build ready to cut down on back and forth.